Profile Besu with Pyroscope
Grafana Pyroscope continuously profiles a running node and shows which code paths consume CPU, memory, and lock time. Use Pyroscope when metrics tell you a node is under load but not which part of Besu is responsible.
The Besu Docker image bundles the Pyroscope Java agent and a default agent configuration file. The agent is inactive until you attach it.
The Docker image bundles the agent from Besu 25.6.0 onwards. The binary distribution doesn't include it, so use Java Flight Recorder to profile a node installed from the binary distribution.
Prerequisites
- A Pyroscope server your Besu container can reach.
- A Grafana instance with a Pyroscope data source to view the profiles.
Enable the agent
Attach the bundled agent using BESU_OPTS, and set PYROSCOPE_SERVER_ADDRESS to the address of your Pyroscope server:
- Docker
- Docker Compose
docker run -p 8545:8545 -p 30303:30303 \
  -e BESU_OPTS=-javaagent:/opt/besu/pyroscope/pyroscope.jar \
  -e PYROSCOPE_SERVER_ADDRESS=http://<PYROSCOPE_HOST>:4040 \
  -e PYROSCOPE_APPLICATION_NAME=<NODE_NAME> \
  hyperledger/besu:latest --network=sepolia
services:
  besu:
    image: hyperledger/besu:latest
    command: --network=sepolia
    environment:
      BESU_OPTS: -javaagent:/opt/besu/pyroscope/pyroscope.jar
      PYROSCOPE_SERVER_ADDRESS: http://pyroscope:4040
      PYROSCOPE_APPLICATION_NAME: <NODE_NAME>
    ports:
      - 8545:8545
      - 30303:30303
PYROSCOPE_APPLICATION_NAME is the name the node appears under in Grafana. Set a distinct value for each node so you can tell profiles apart.
If you run Pyroscope in the same Docker network under the hostname pyroscope, on the default port 4040, you can omit PYROSCOPE_SERVER_ADDRESS. That address is already the default in the bundled configuration.
View profiles in Grafana
Select the Pyroscope data source in Grafana, then select your node under Service and a profile type such as process_cpu:cpu. The flame graph shows the call stacks that consumed the most CPU over the selected time range, and the table lists the same data by symbol.
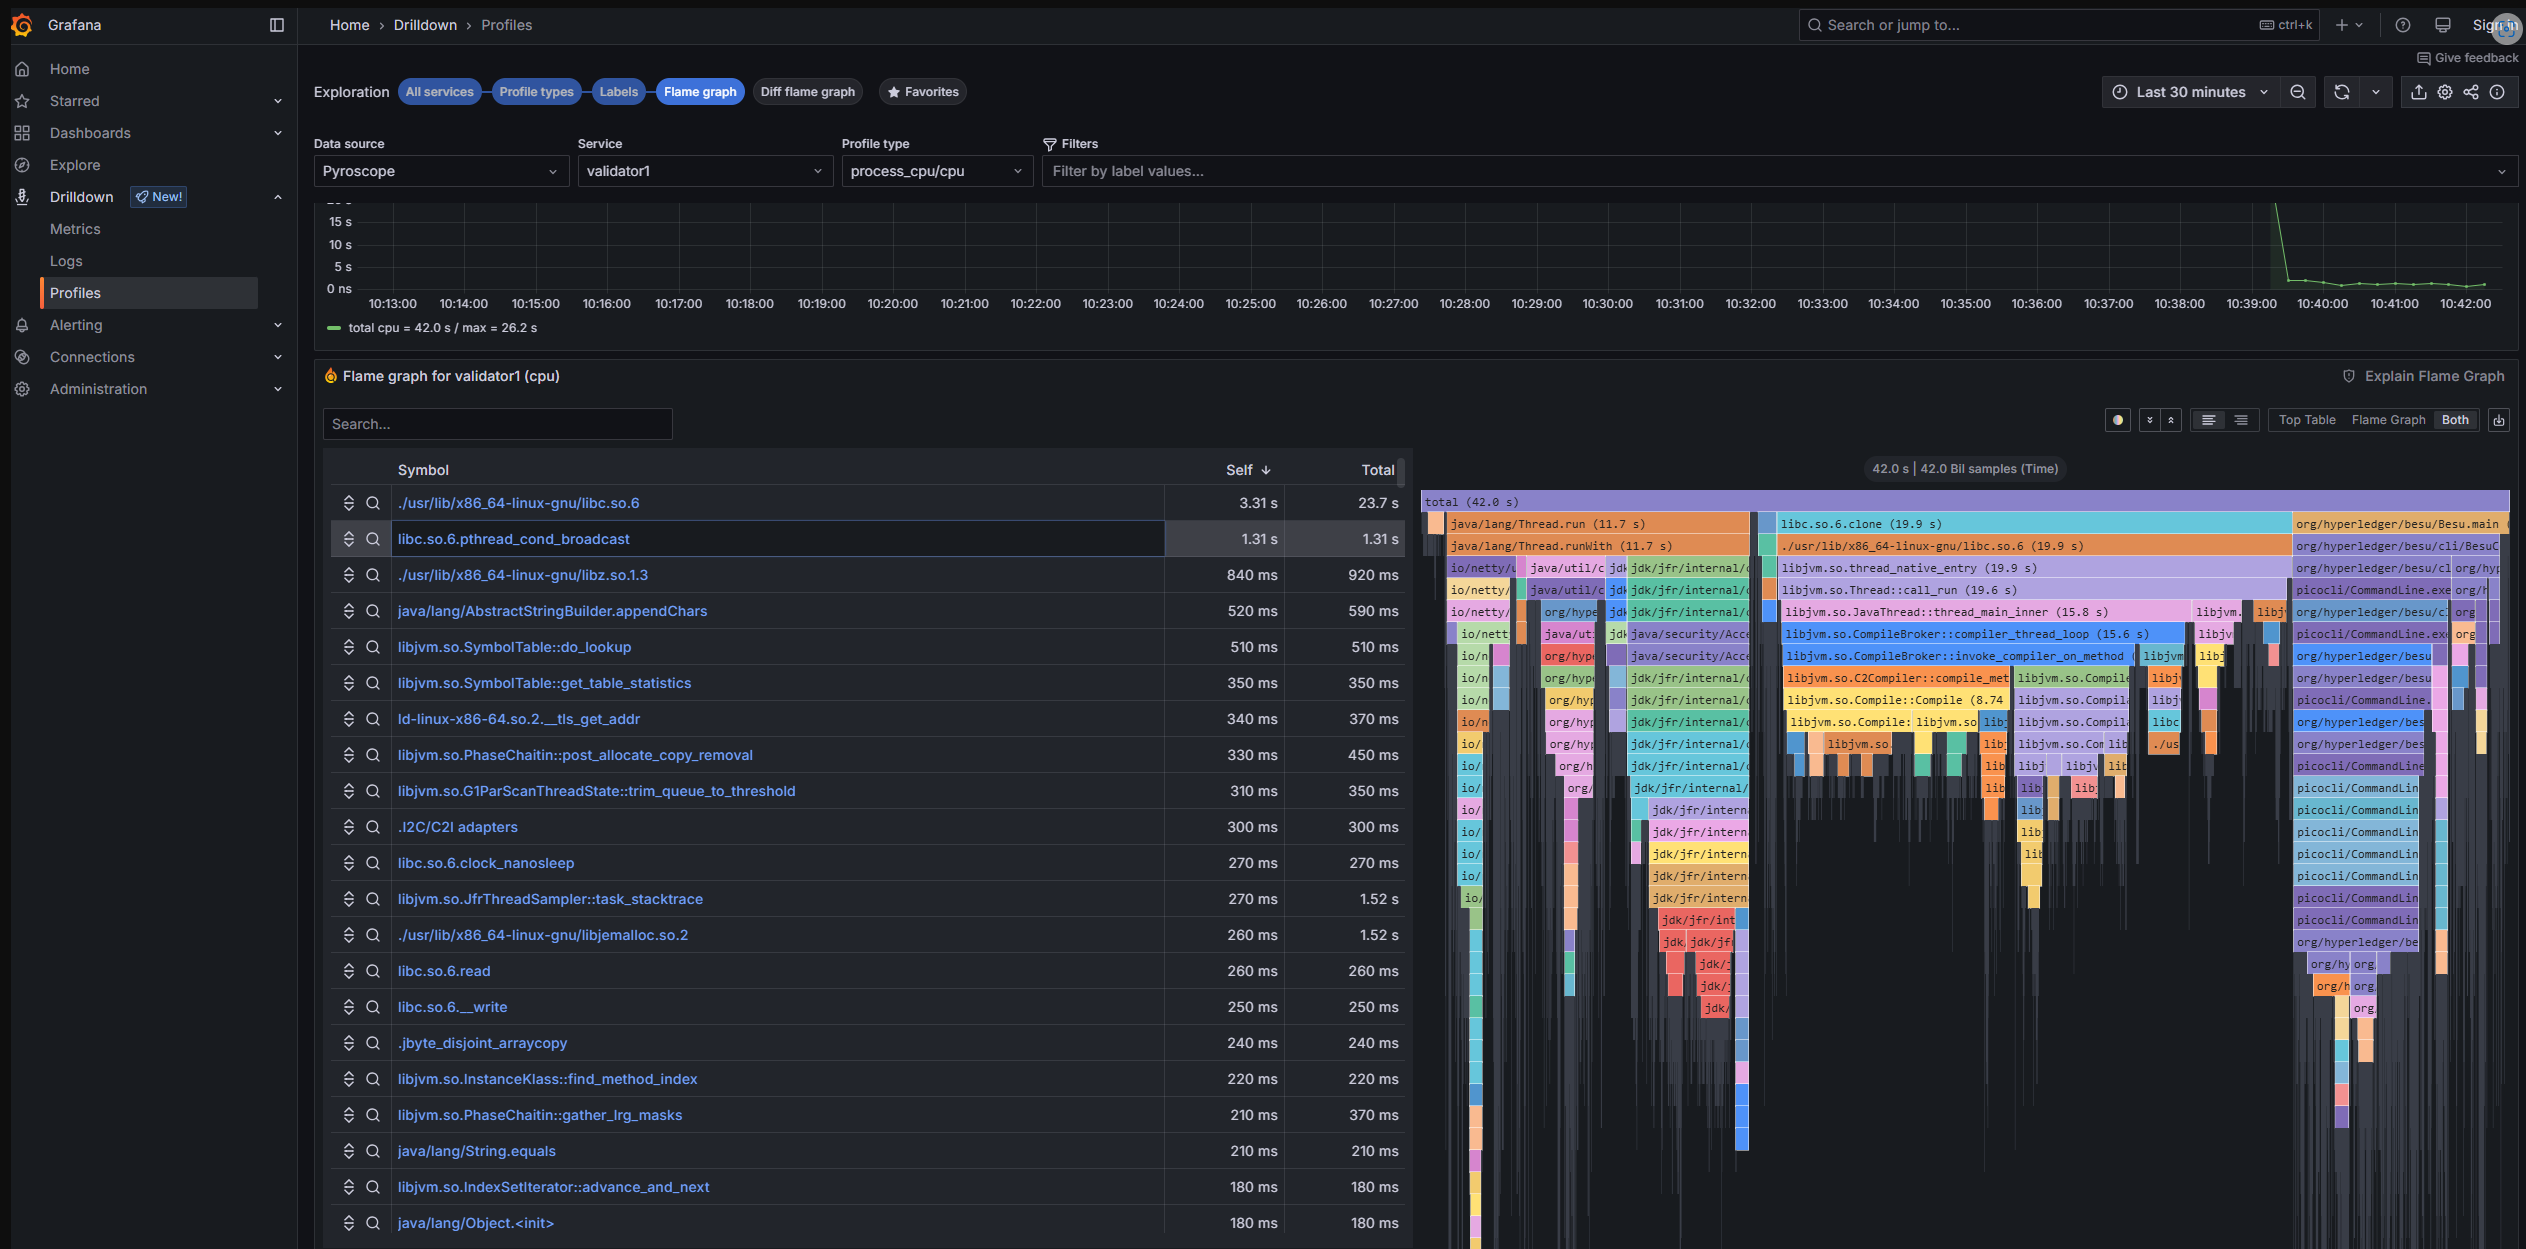
The root frame sits at the top of the flame graph, and each row below it shows the functions that frame called. A bar's width is the proportion of samples in which that function was on the stack, so wide bars deep in the graph are the hotspots worth investigating.
Change the agent configuration
The image sets PYROSCOPE_CONFIGURATION_FILE to /etc/besu/pyroscope.properties, which contains the following defaults:
| Property | Environment variable | Default |
|---|---|---|
pyroscope.server.address | PYROSCOPE_SERVER_ADDRESS | http://pyroscope:4040 |
pyroscope.application.name | PYROSCOPE_APPLICATION_NAME | besu |
pyroscope.format | PYROSCOPE_FORMAT | jfr |
pyroscope.profiling.event | PYROSCOPE_PROFILING_EVENT | itimer |
pyroscope.profiling.interval | PYROSCOPE_PROFILING_INTERVAL | 10ms |
pyroscope.profiling.alloc | PYROSCOPE_PROFILING_ALLOC | 512k |
pyroscope.profiling.lock | PYROSCOPE_PROFILING_LOCK | 10ms |
pyroscope.upload.interval | PYROSCOPE_UPLOAD_INTERVAL | 15s |
pyroscope.log.level | PYROSCOPE_LOG_LEVEL | debug |
Override any property with the matching environment variable, which is the property name in uppercase with underscores instead of dots. For example, pyroscope.upload.interval becomes PYROSCOPE_UPLOAD_INTERVAL.
The bundled configuration sets the agent log level to debug. Set PYROSCOPE_LOG_LEVEL=info to reduce how much the agent logs.
To replace the configuration wholesale, mount your own properties file over /etc/besu/pyroscope.properties, or point PYROSCOPE_CONFIGURATION_FILE at a different path. Don't use quotes in the properties file.
For the full set of agent options, including authentication for hosted Pyroscope, see the Pyroscope Java SDK documentation.